Planning & Preparation
Demonstrating thoughtful planning, differentiation, and data-informed instruction
Lesson Plans
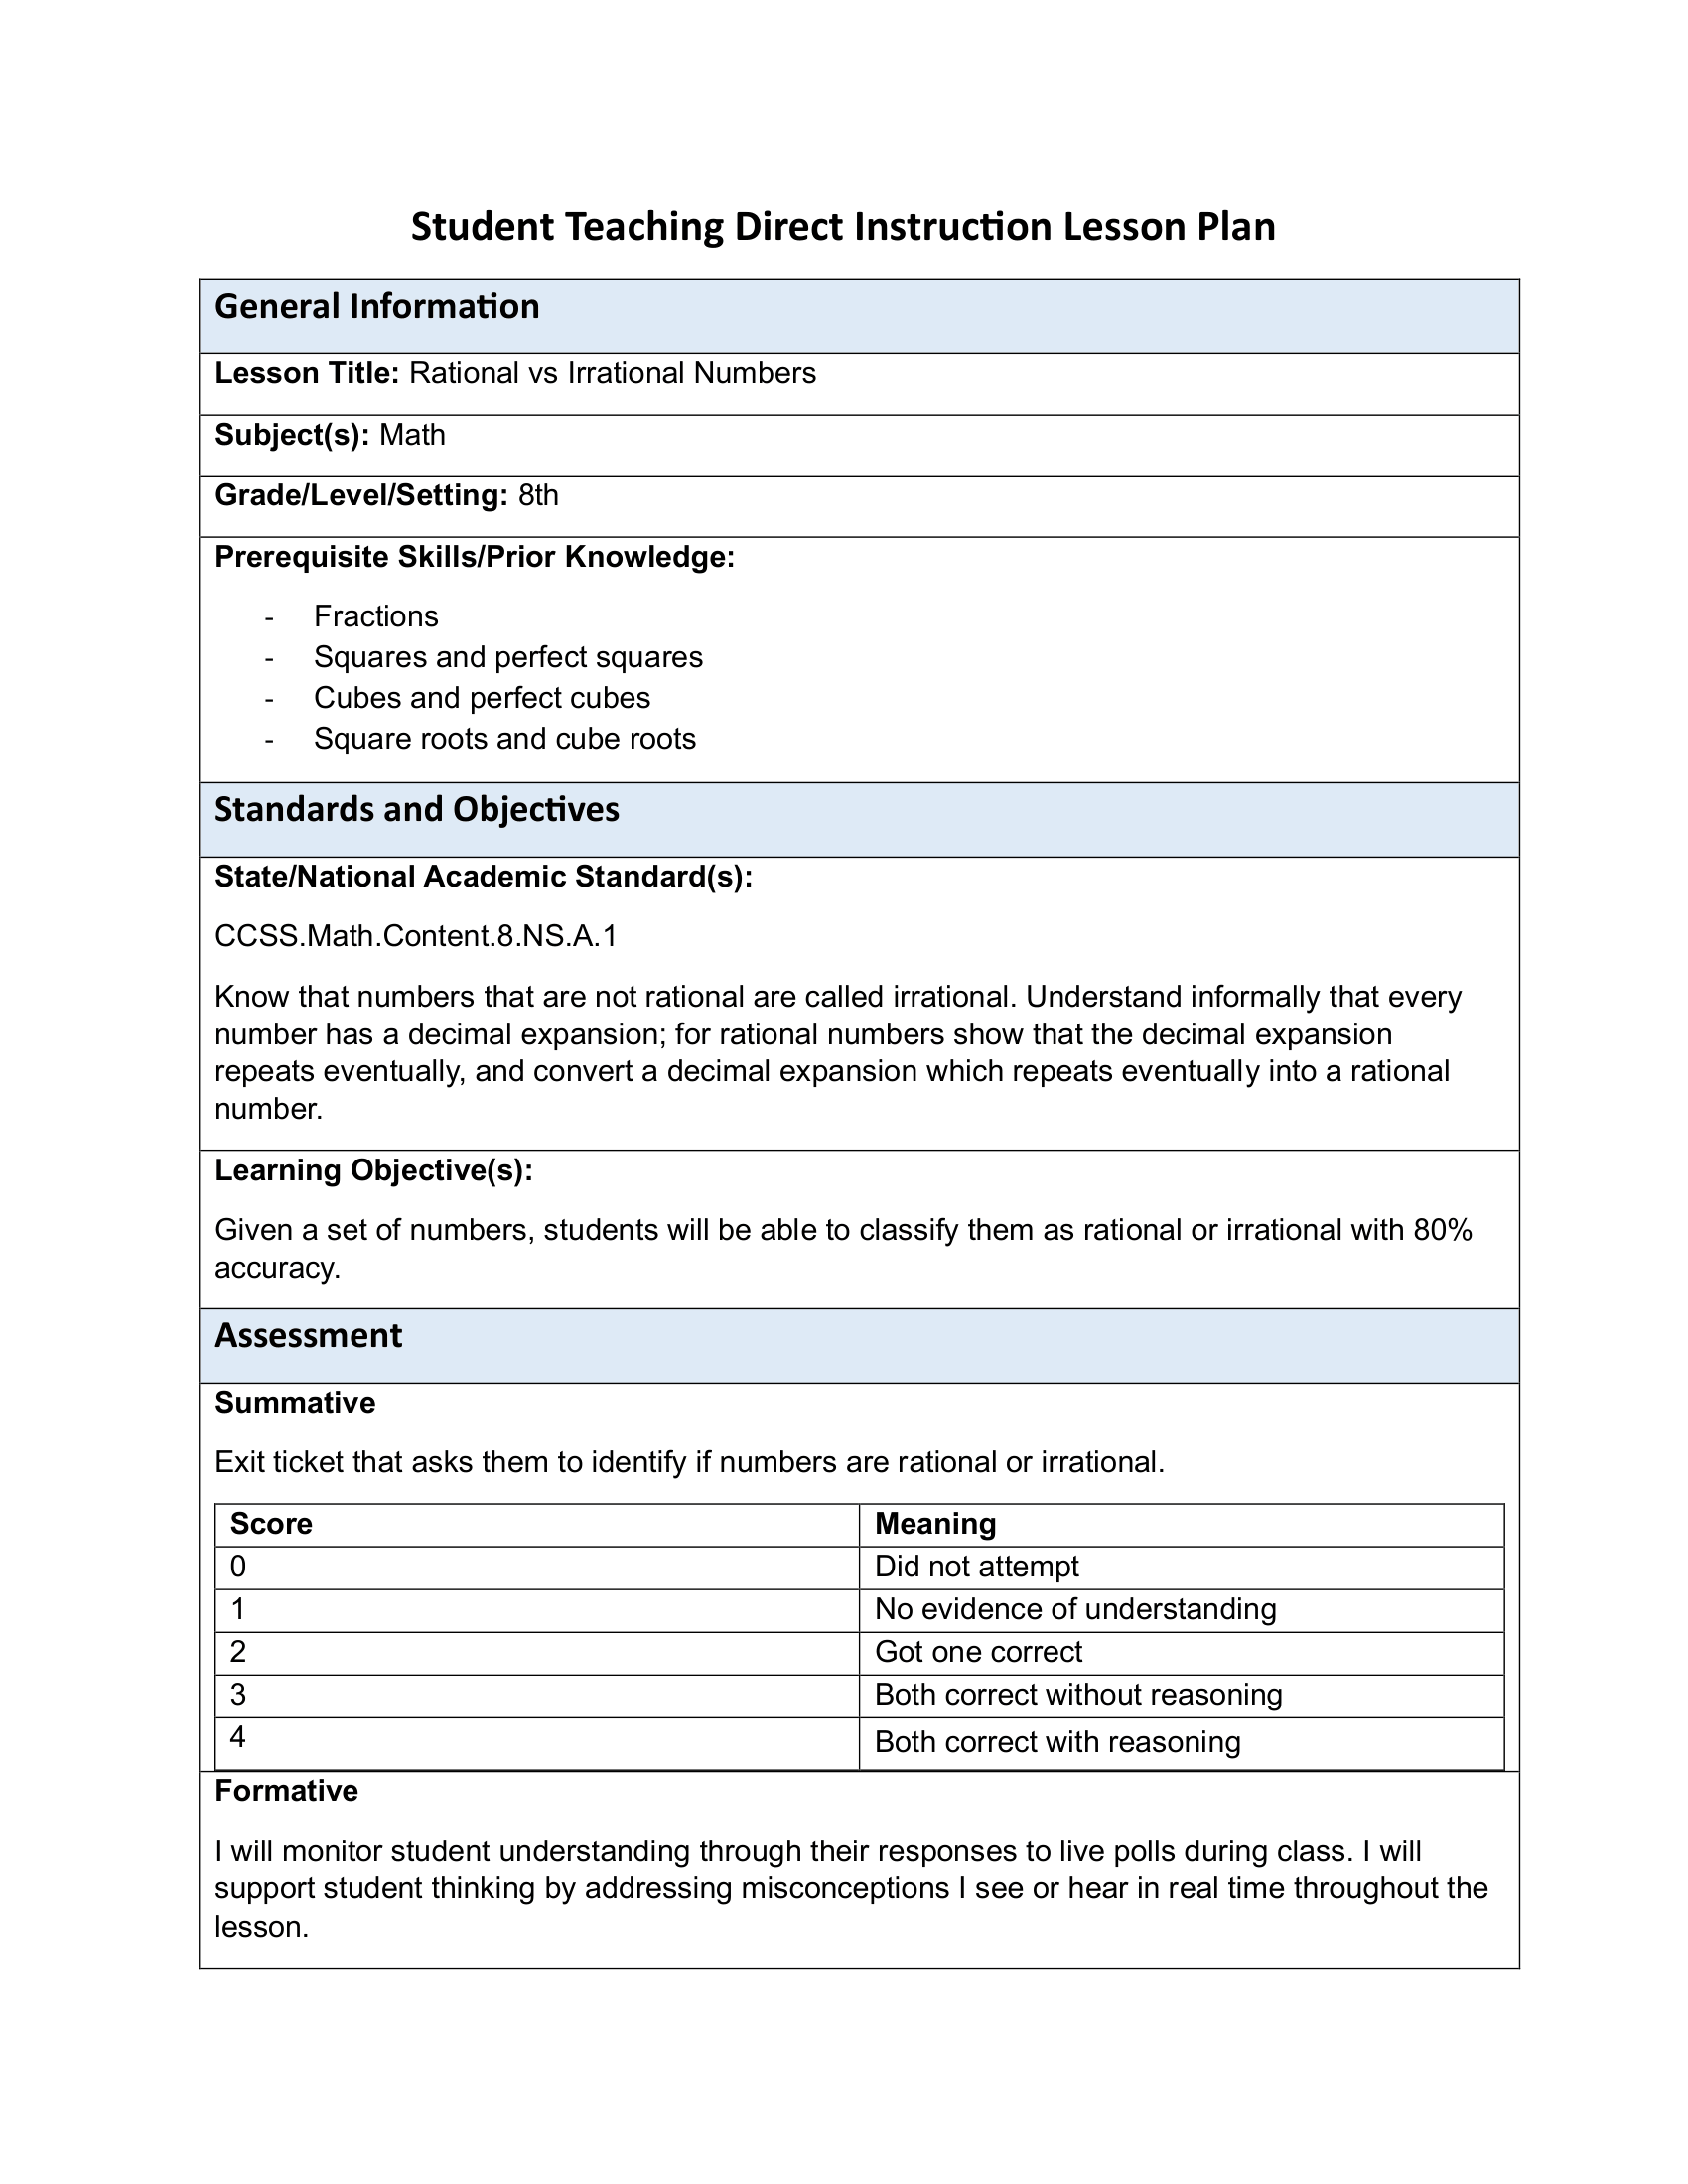
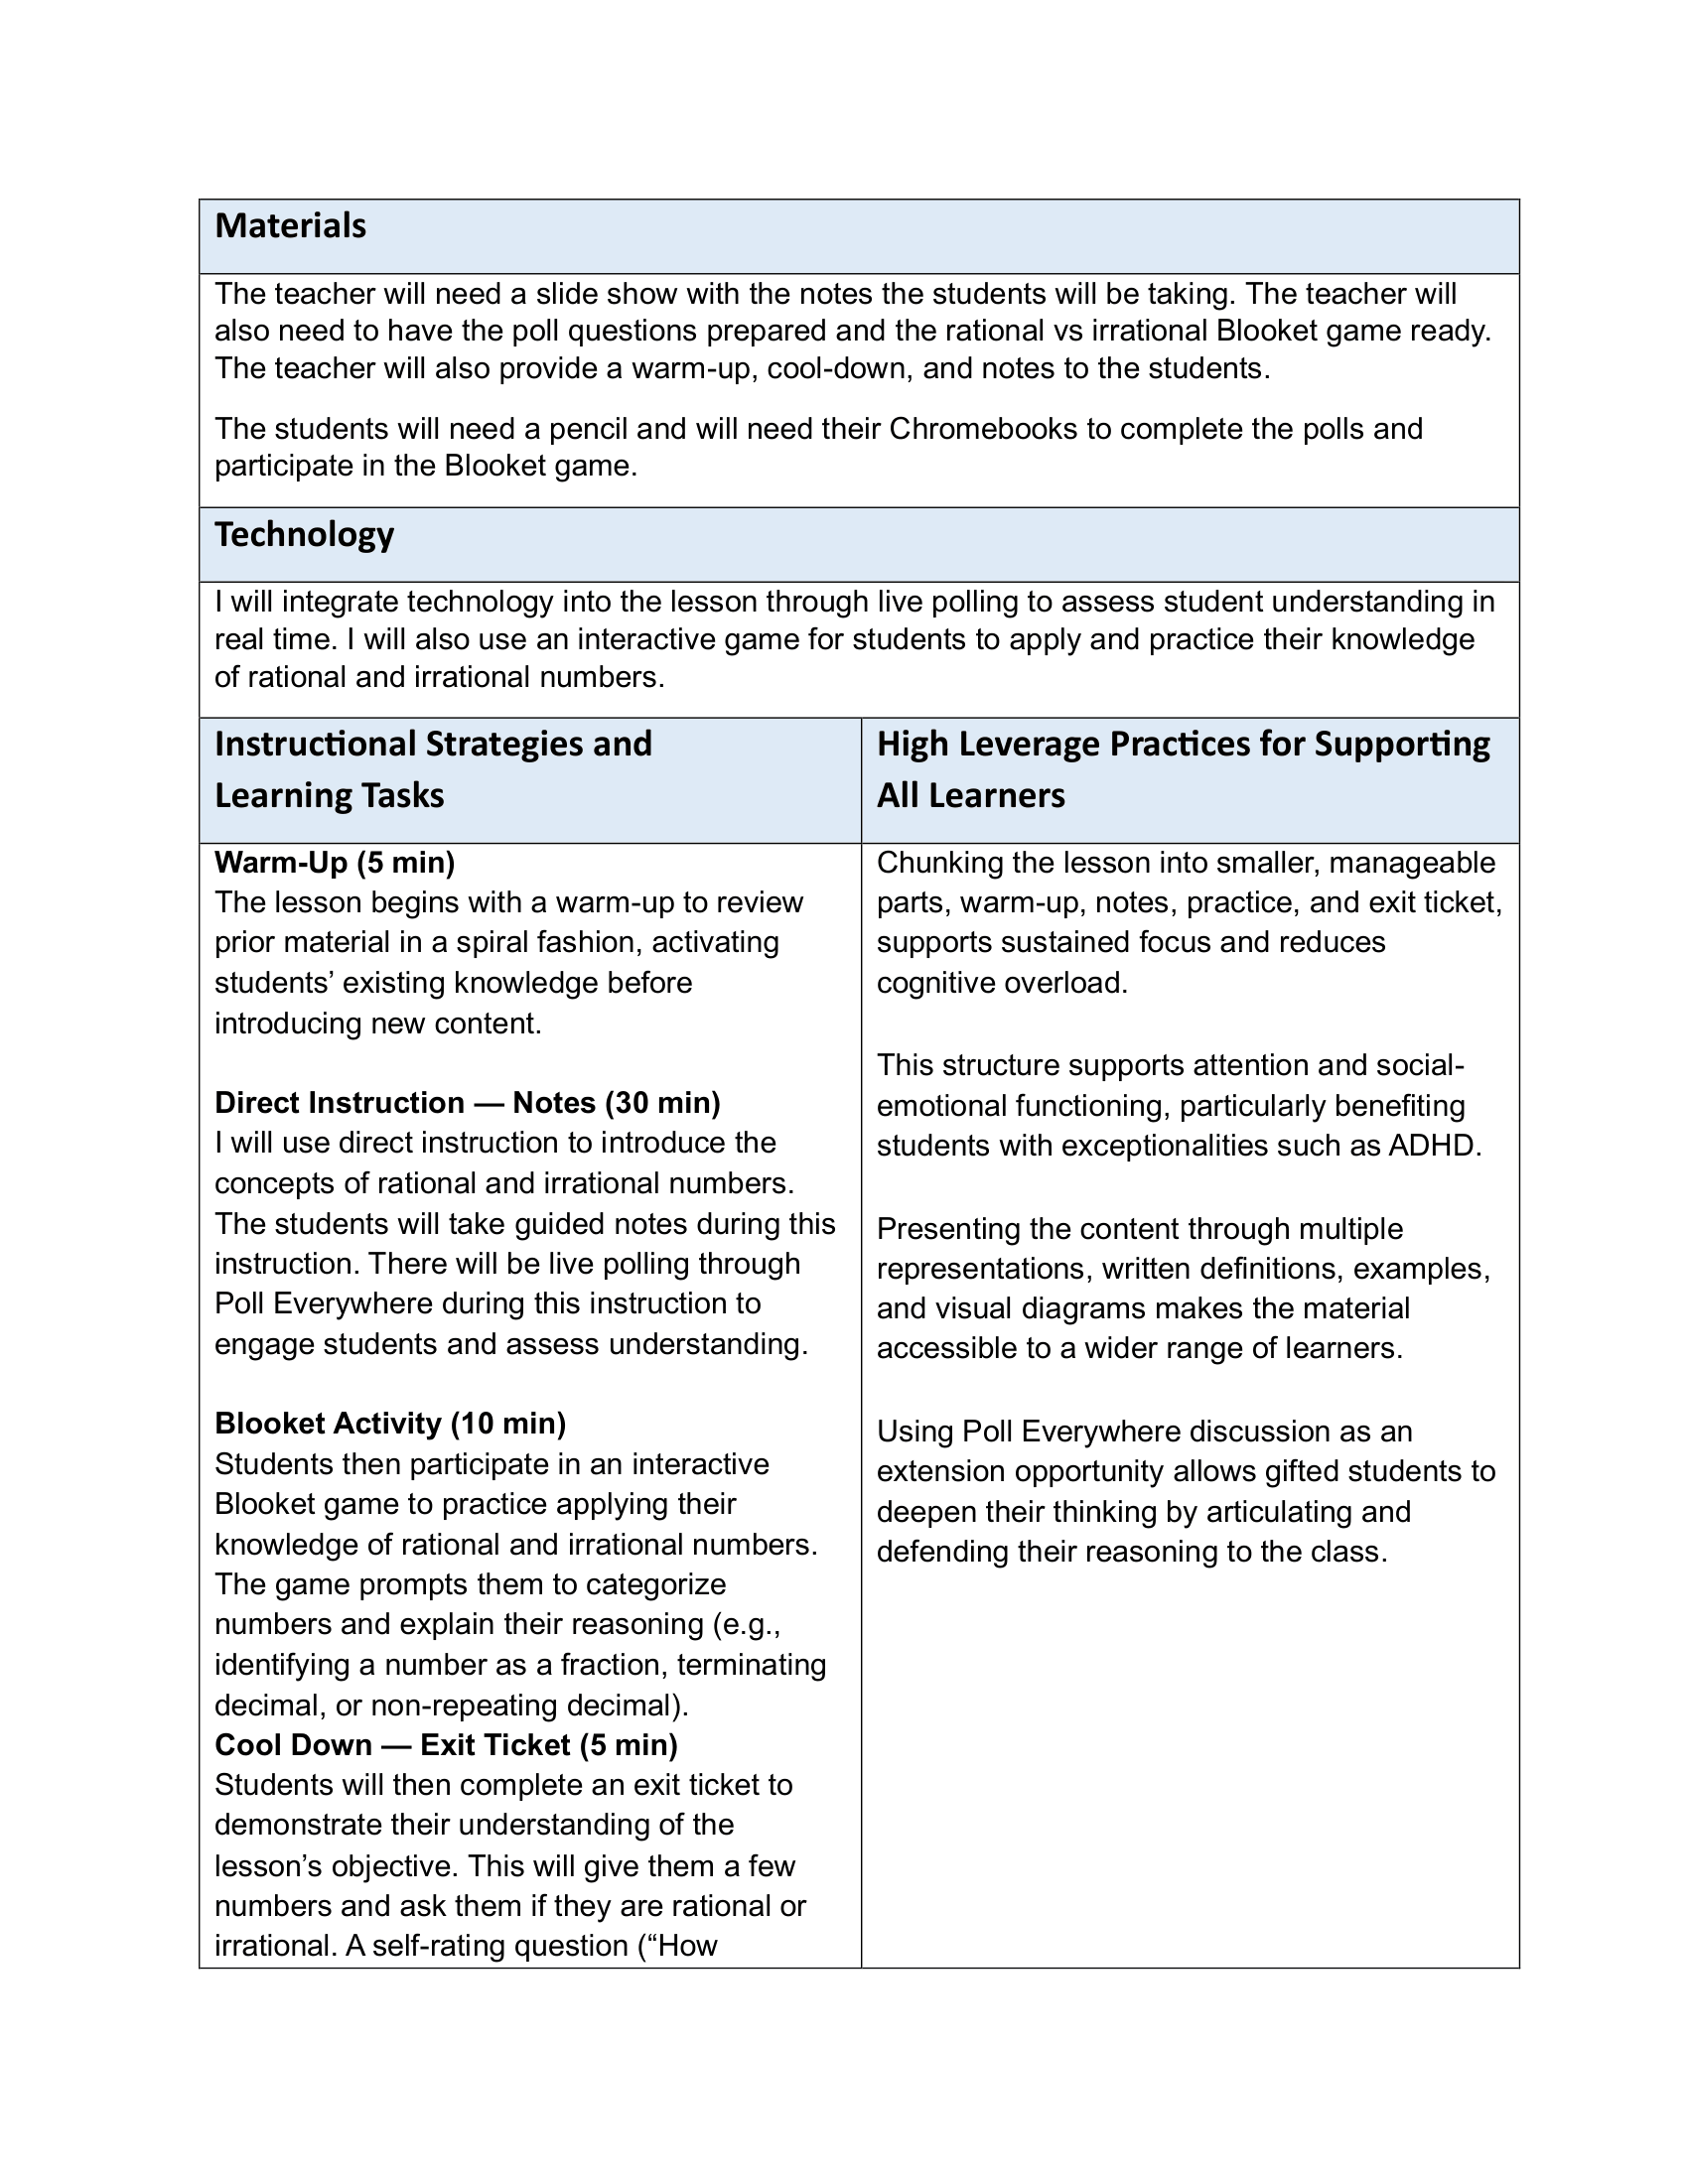
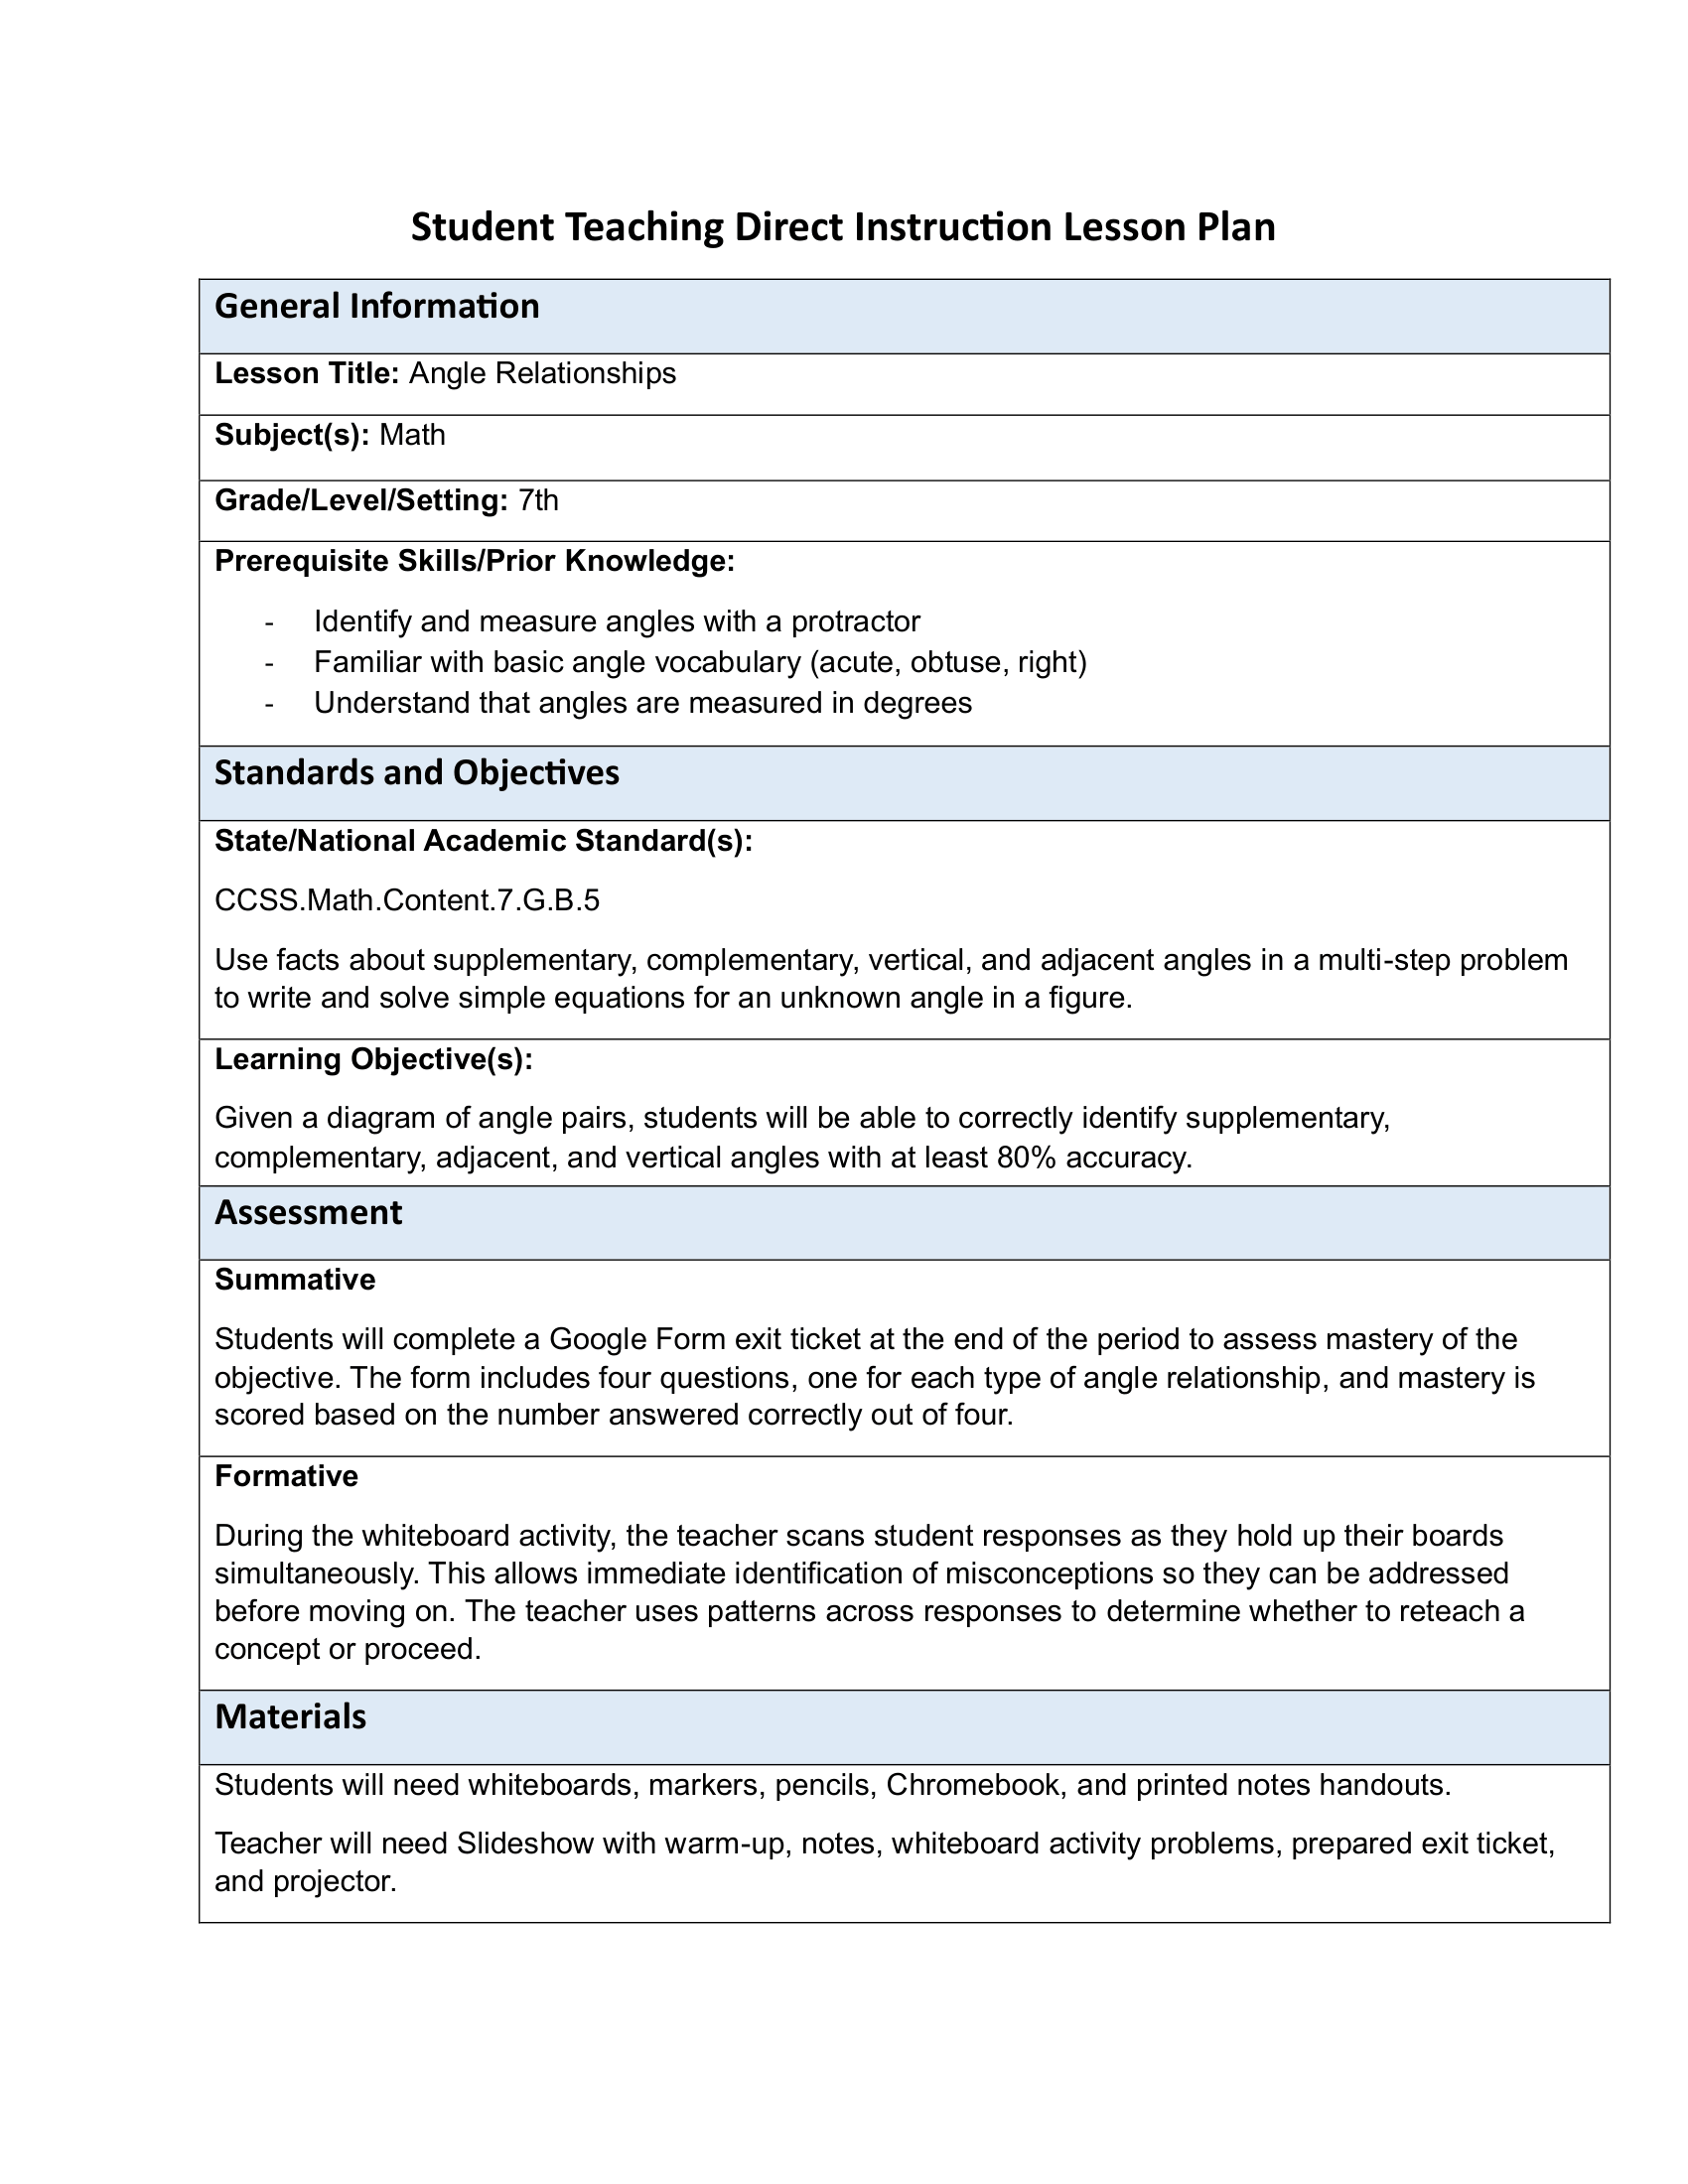
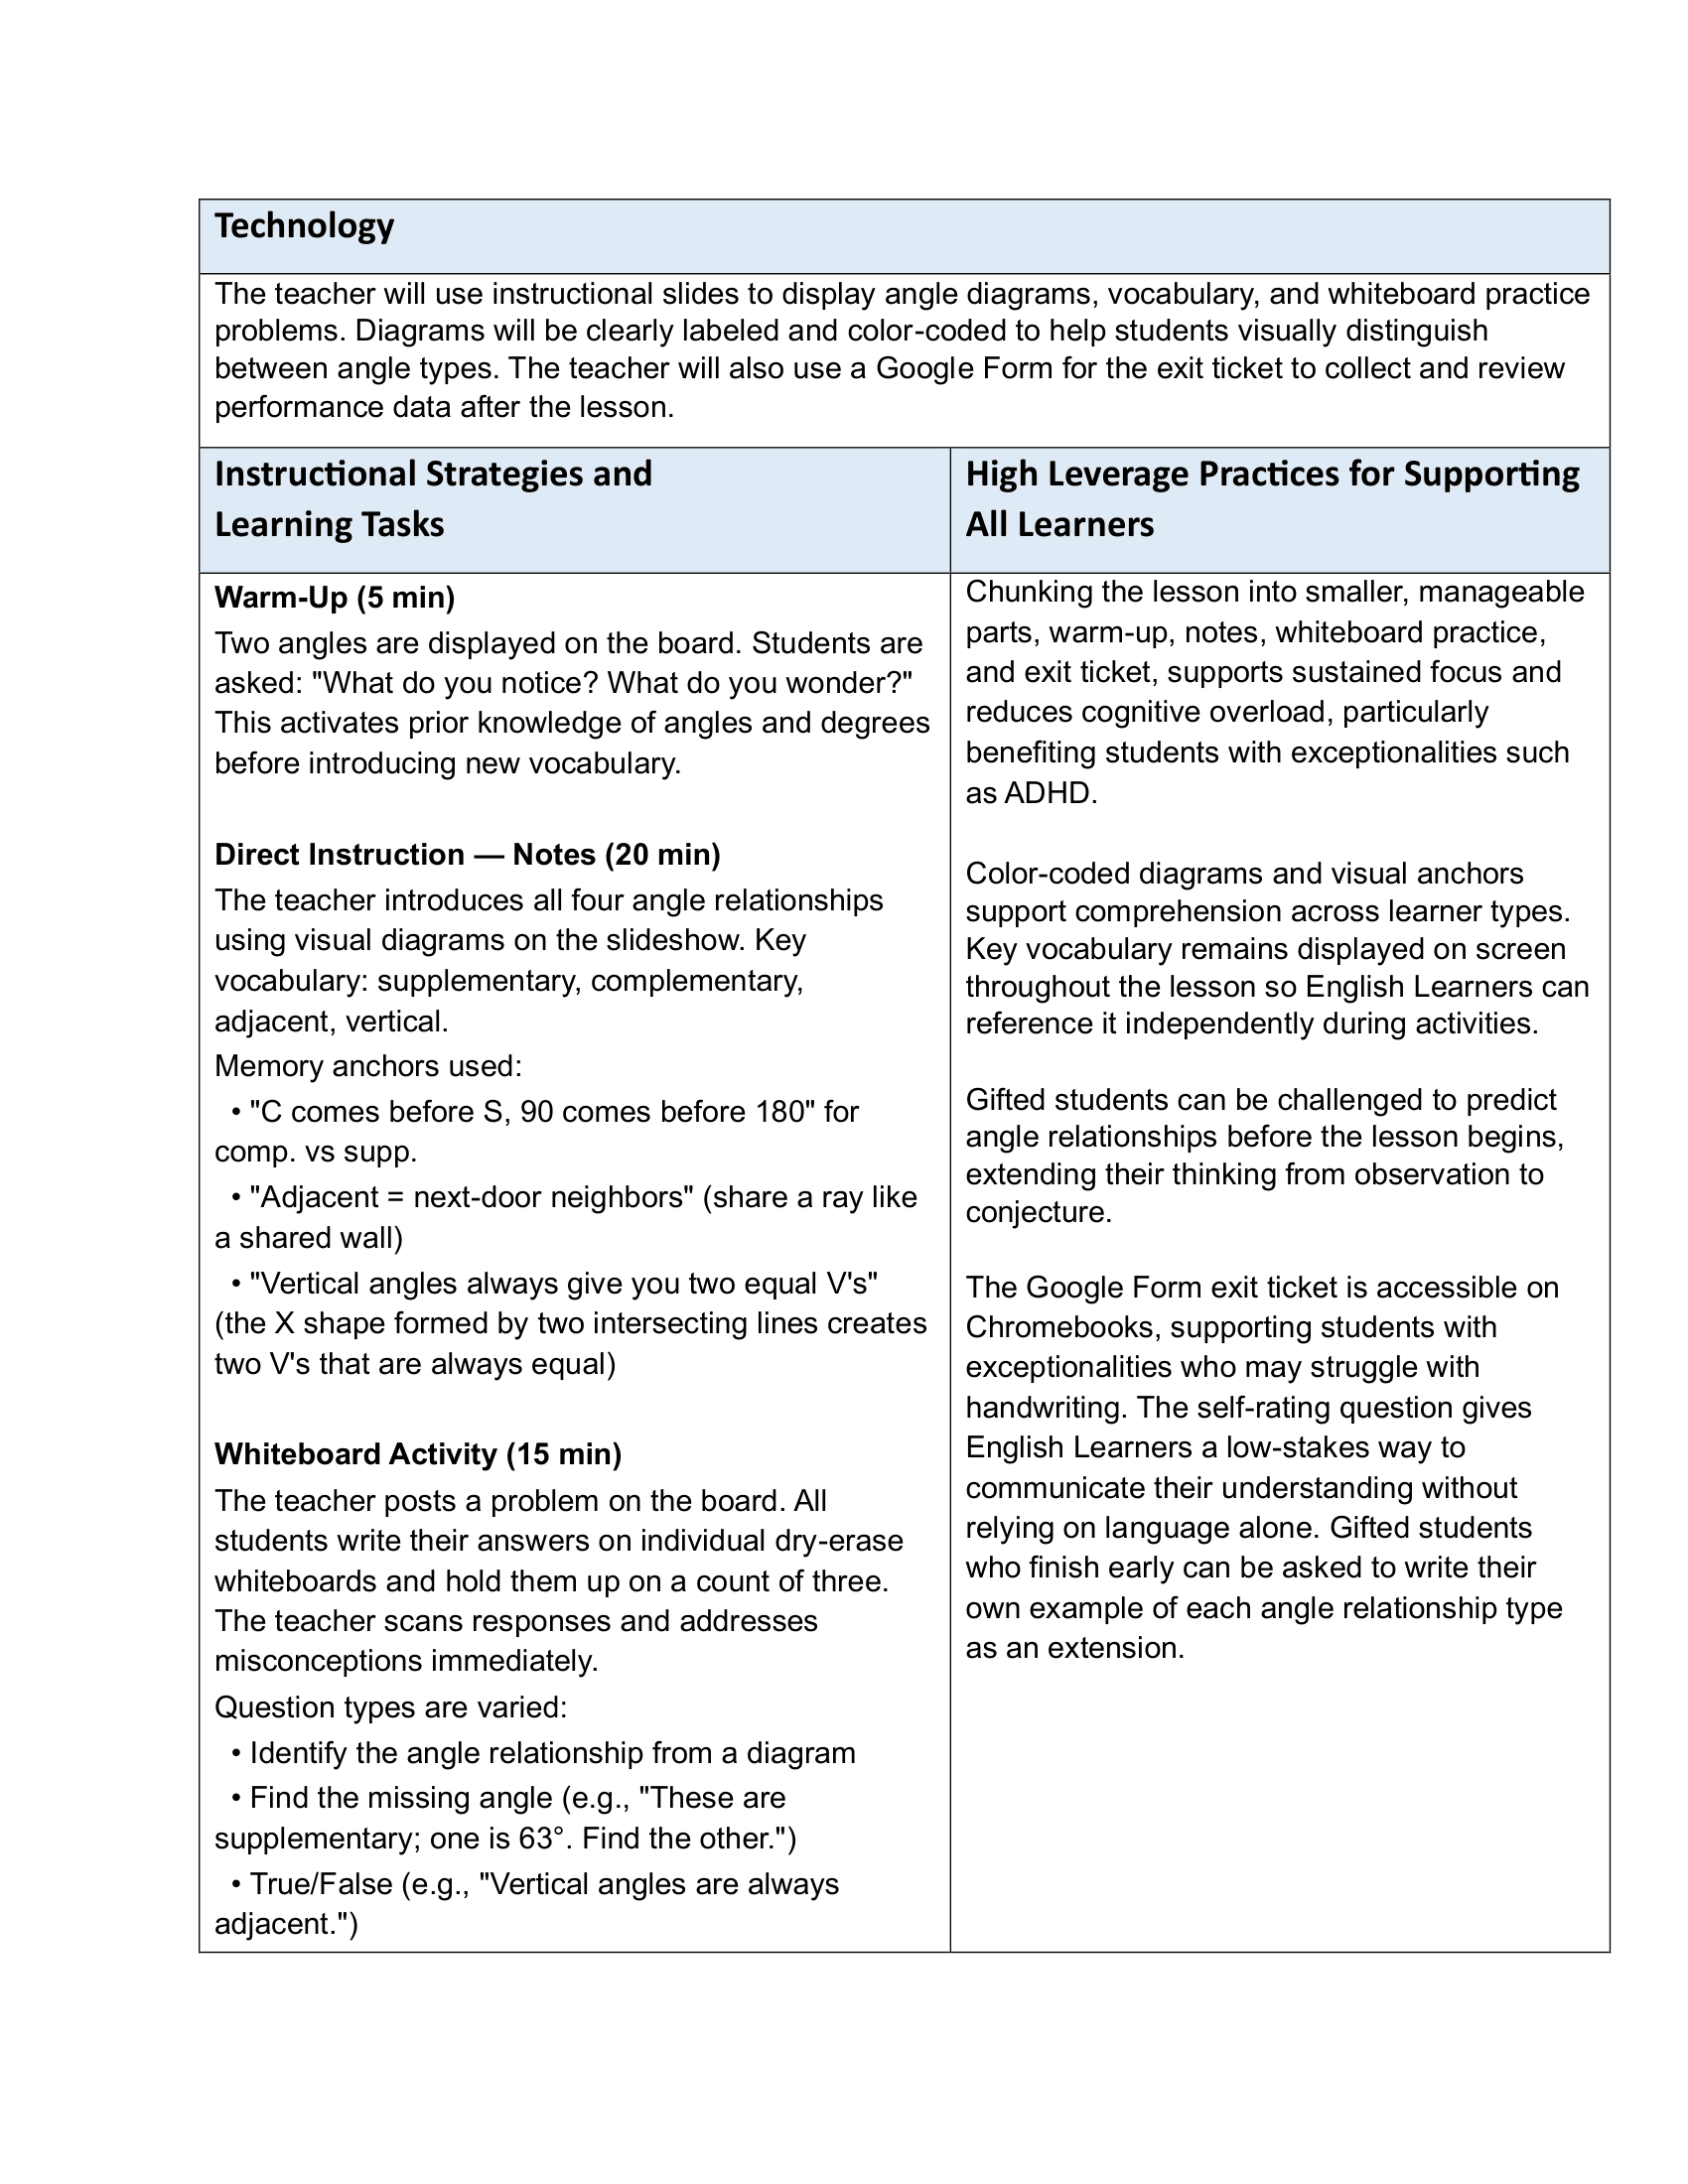
The following lesson plans were designed and taught during my student teaching placement. Each plan reflects my approach to direct instruction, chunking content into manageable parts, incorporating both formative and summative assessment, and building in supports for diverse learners. Both plans follow a warm-up, direct instruction, practice, and exit ticket structure that provides consistency for students while allowing flexibility in how content is delivered.


Differentiated Materials
Effective differentiation means meeting students where they are by adjusting what they learn, how they learn it, and how they demonstrate their understanding. The artifacts below represent my approach to differentiation across three dimensions: content, which addresses the knowledge and skills students are working toward based on their readiness; process, which varies the ways students engage with and make sense of material, including opportunities for student choice and self-directed practice; and product, which offers students multiple ways to demonstrate their learning and show what they know.
Content
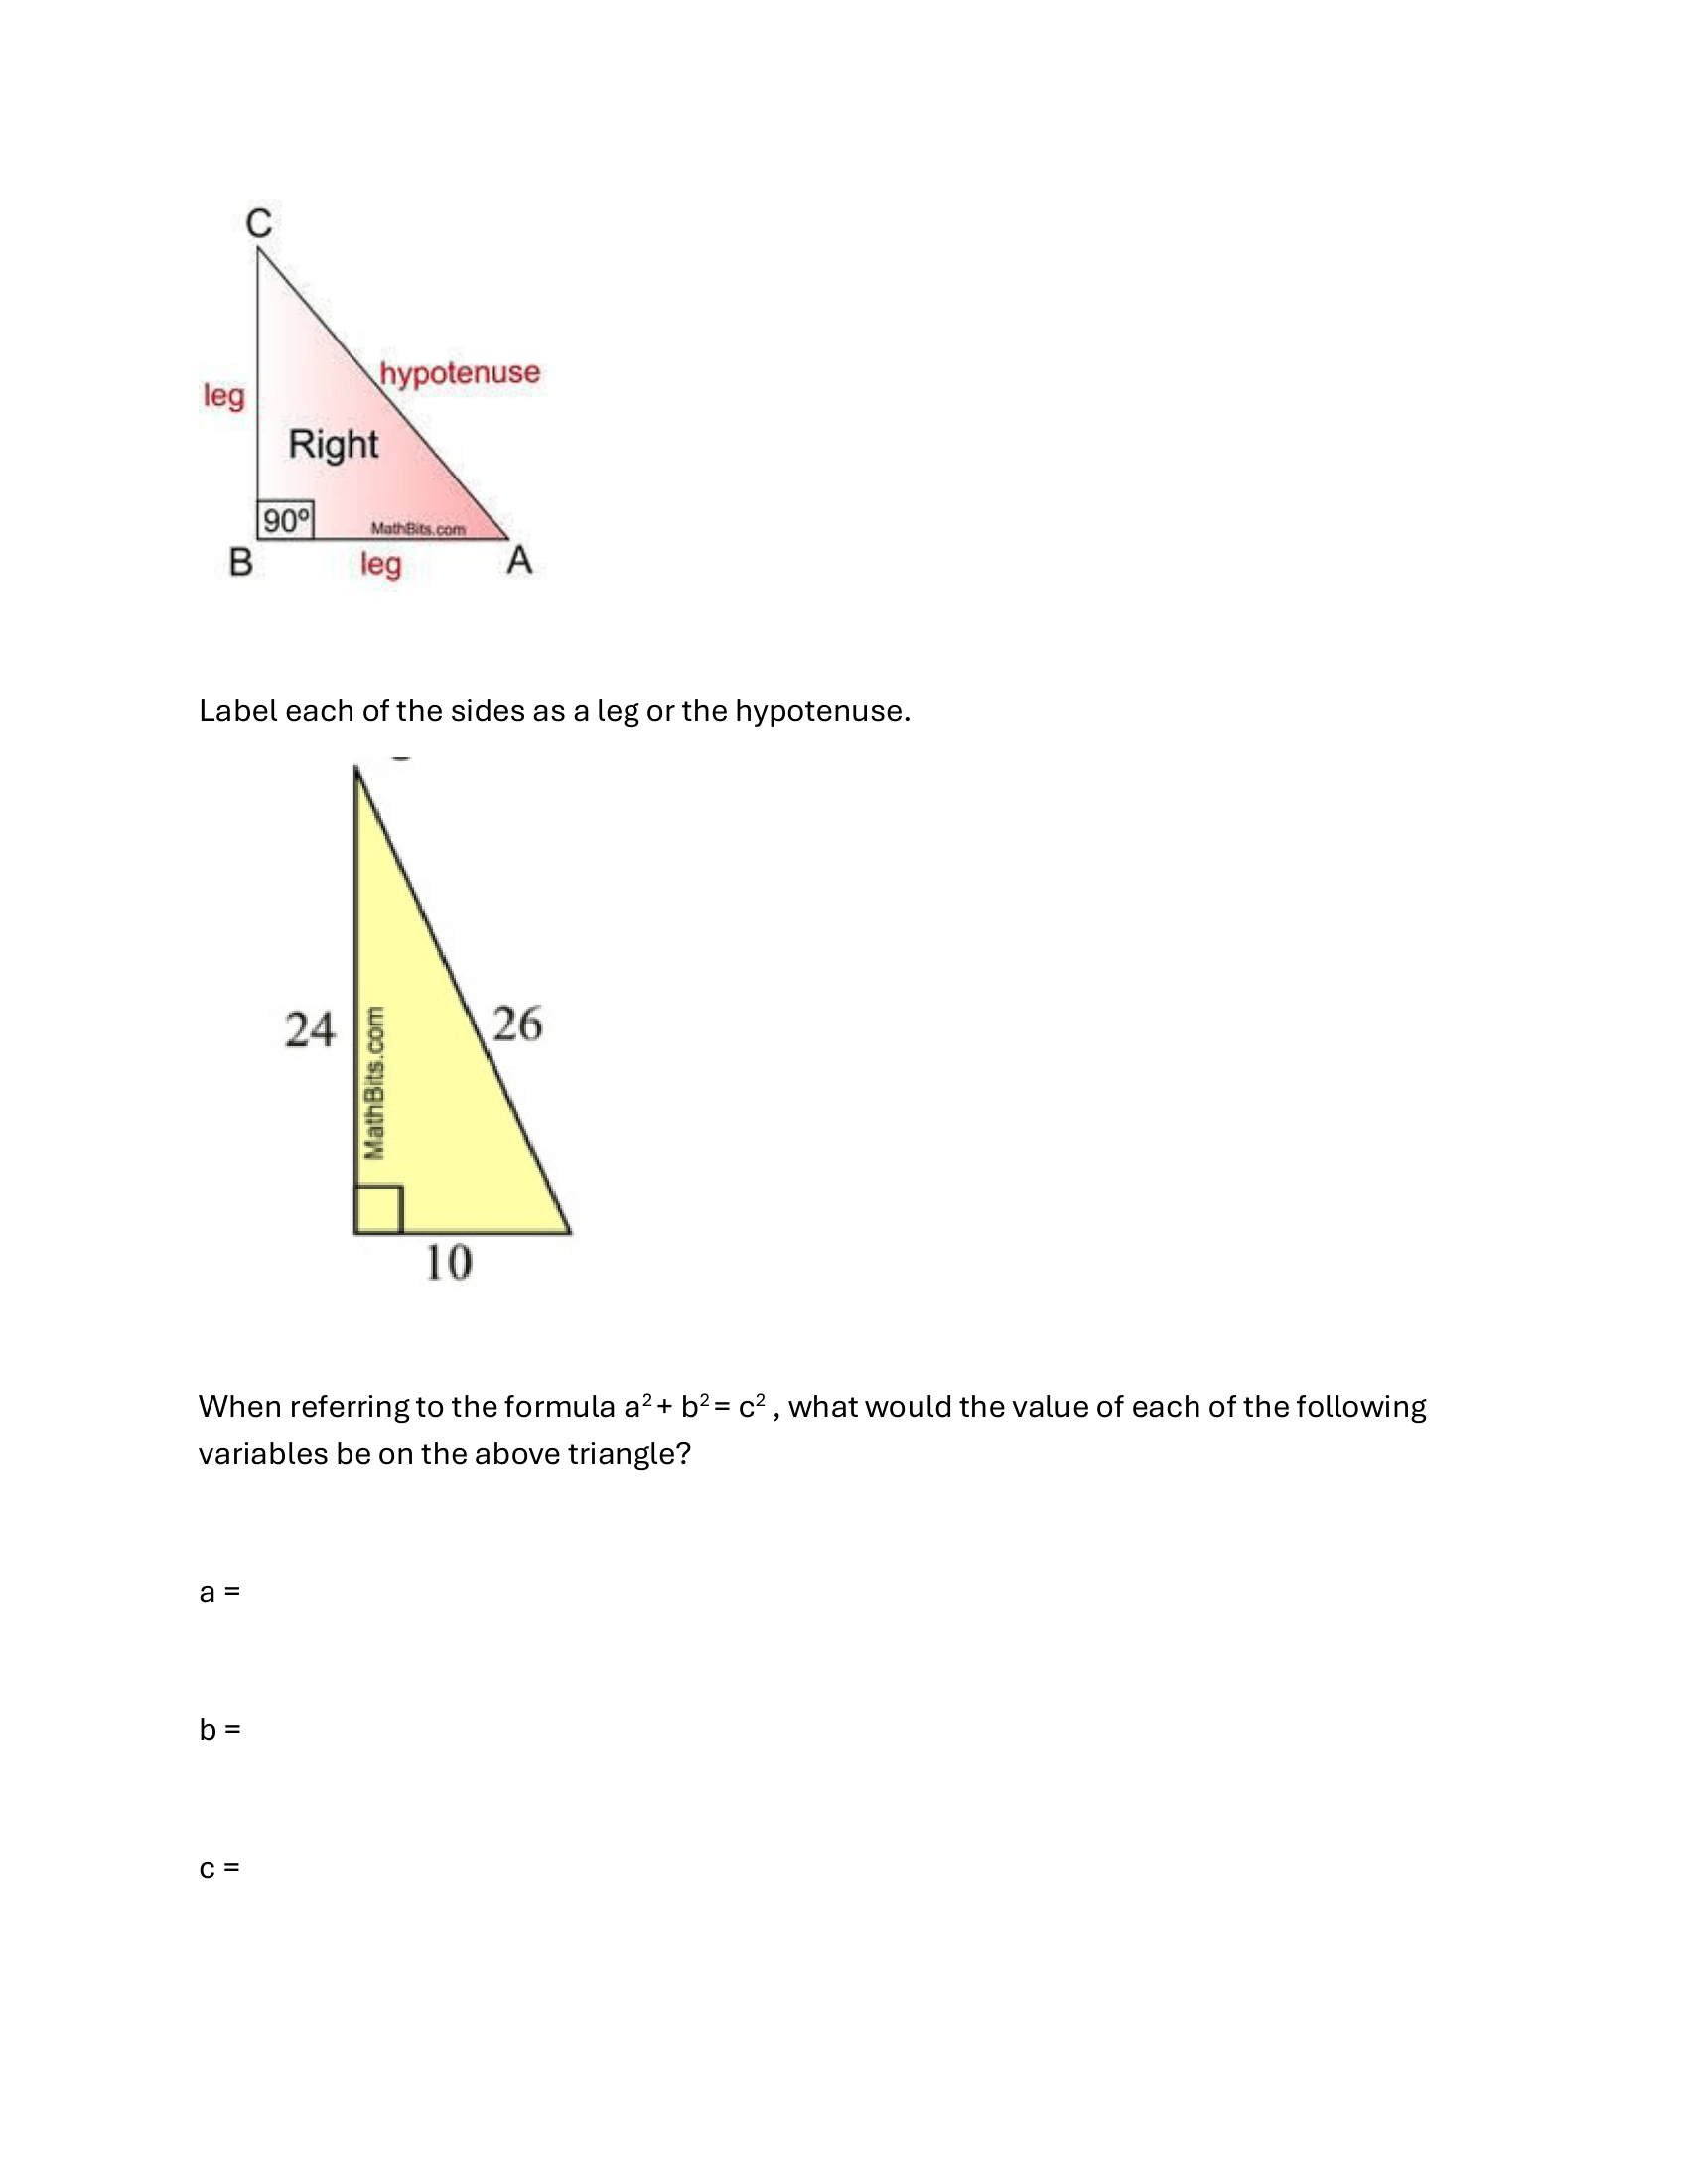
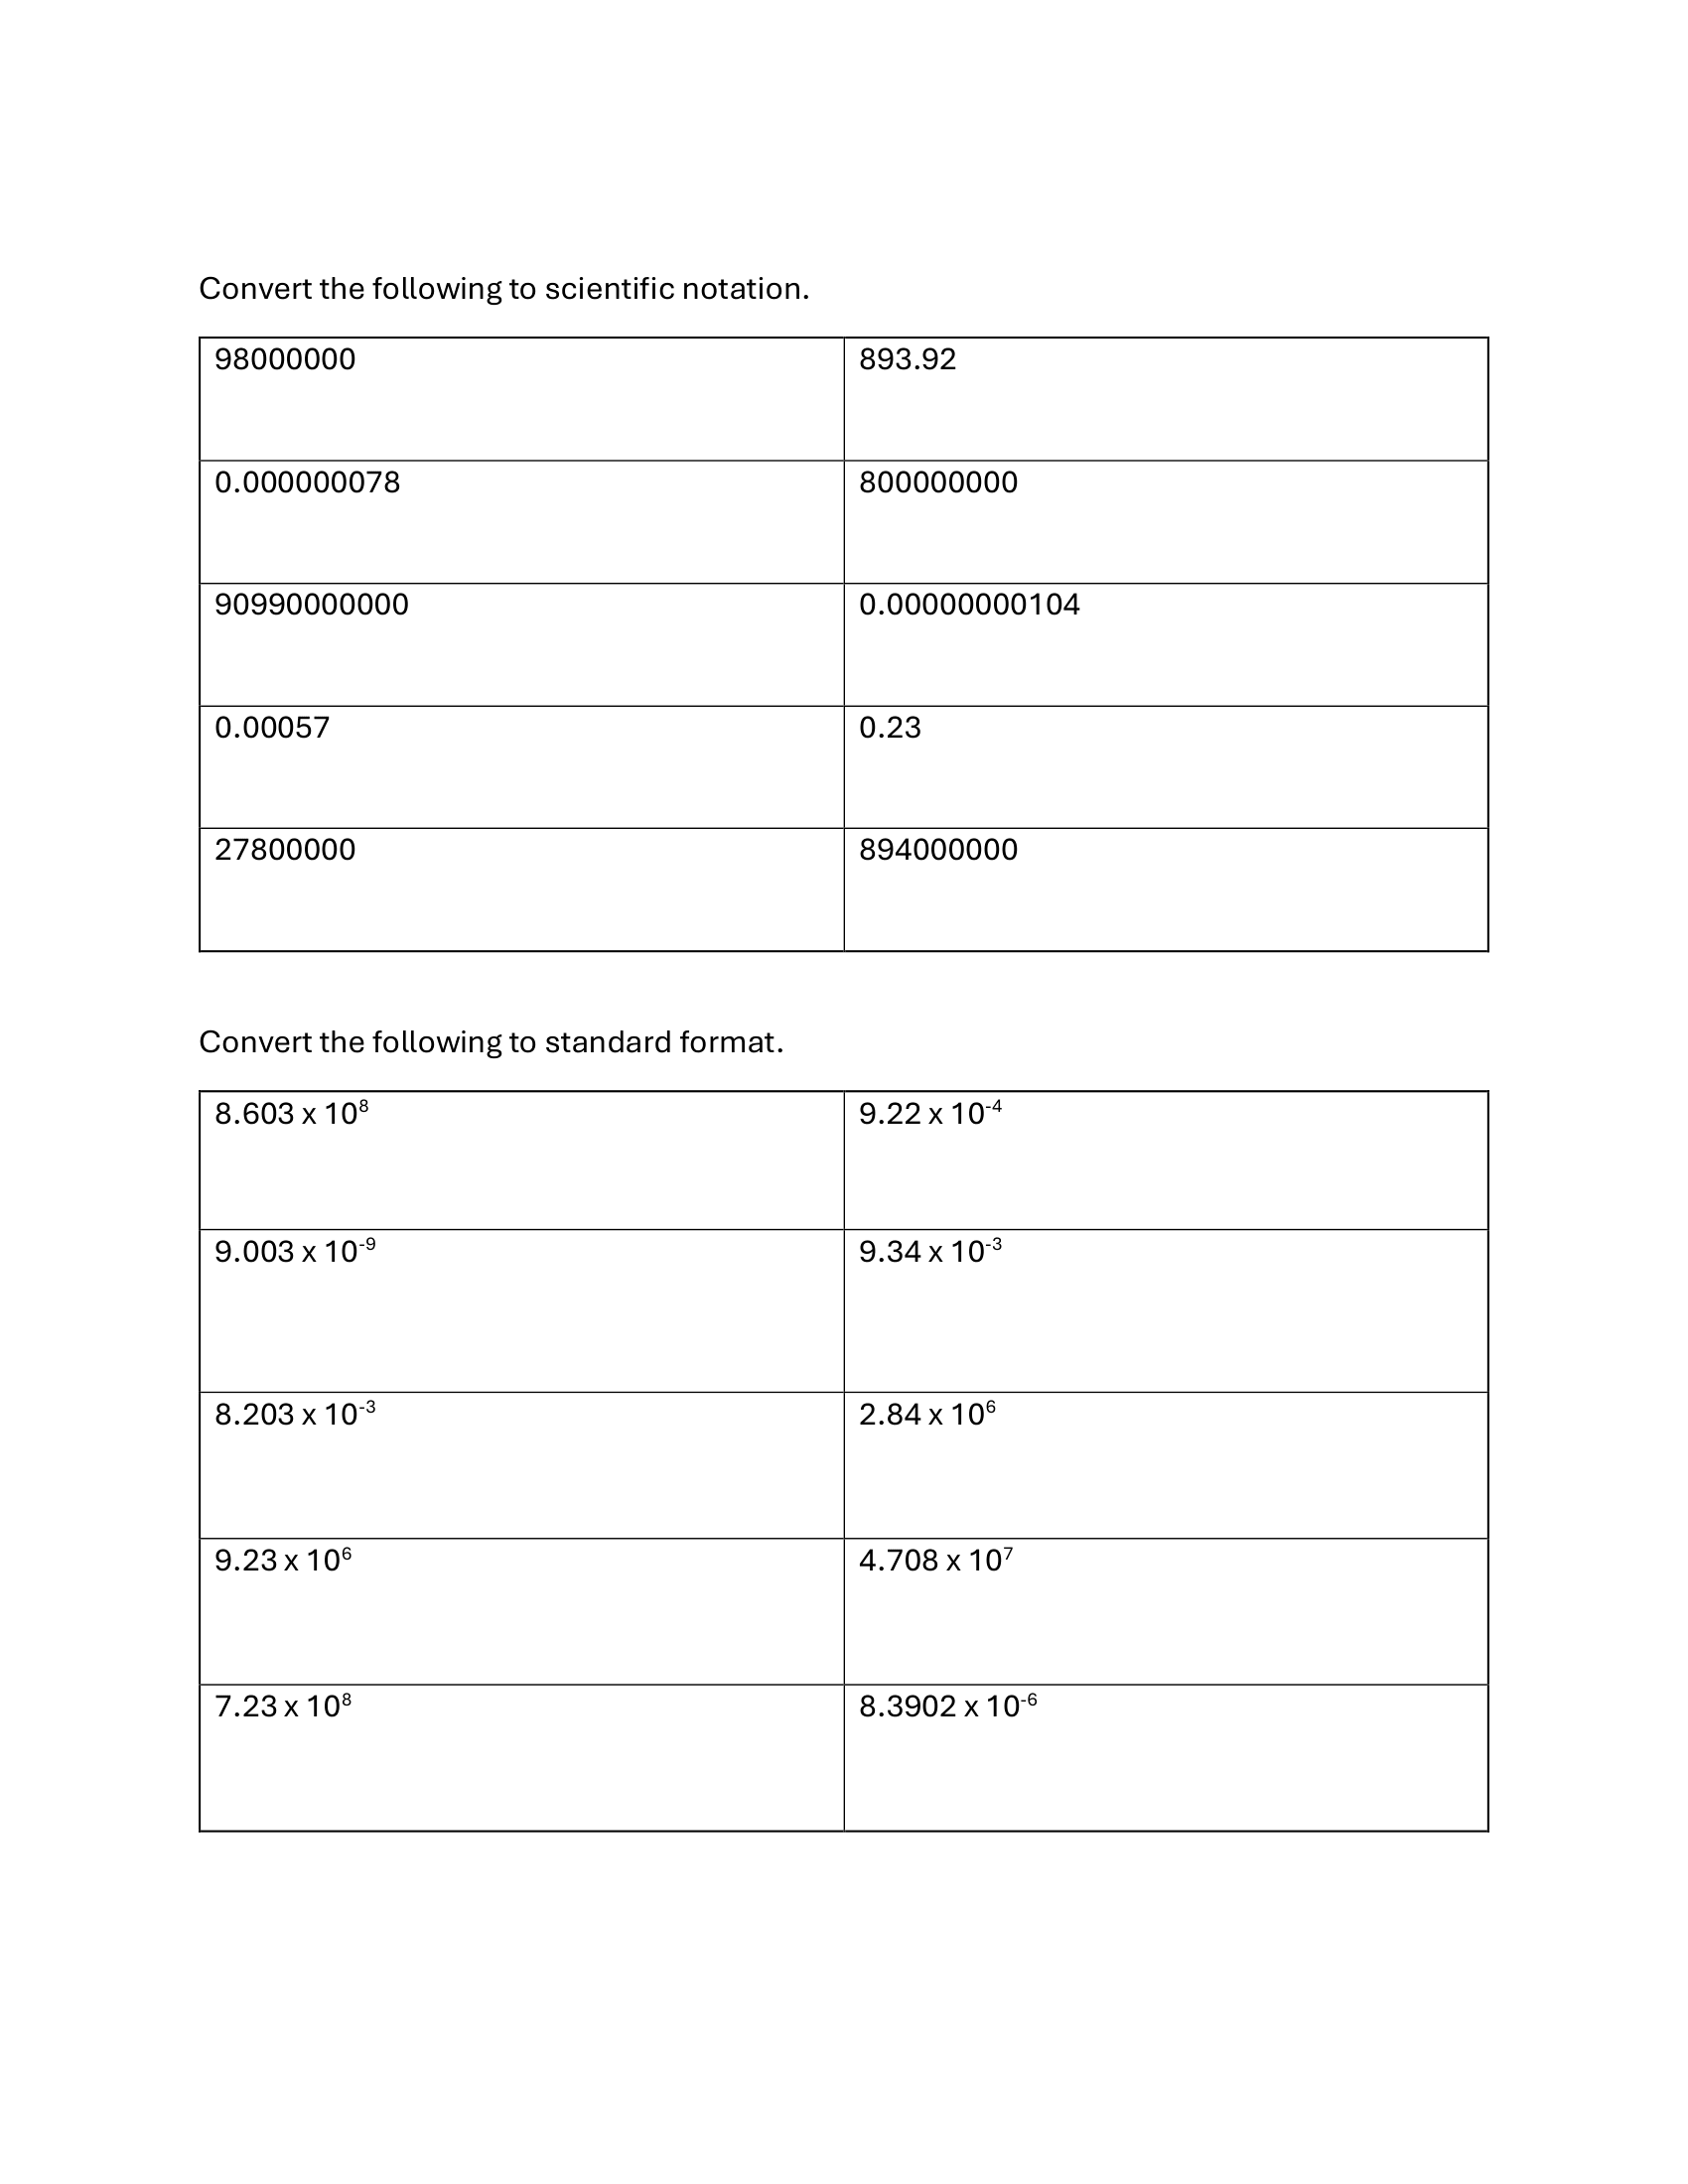
One method I used to differentiate content was by providing leveled practice materials for students. This activity has all students start at the same problem and then move on to problems of increasing difficulty after they demonstrate mastery of the previous level. This allows students to build confidence and fluency with foundational skills before moving on to more complex applications, while also providing a clear pathway for students who are ready to be challenged. The structure of the activity also allows for immediate feedback and self-assessment, as students get their work checked at each level before progressing, which supports a growth mindset and encourages perseverance.
Process
Differentiating by process means varying the ways students engage with and make sense of content based on their individual needs and readiness. The following lesson was designed around a student self-assessment in which students reflected on their own confidence and understanding across three skills within our scientific notation unit: converting between standard and scientific notation, adding and subtracting with the same power of ten, and adding and subtracting with different powers of ten. Based on their self-assessment, students selected the practice problems most relevant to their own areas of difficulty, giving them agency over their learning and encouraging the development of self-monitoring skills. Rather than assigning the same set of problems to every student, this approach allowed each student to spend their practice time where it would be most meaningful for their individual growth.
Step 1 — Student Self-Assessment
Students completed the following self-assessment to identify which skills they wanted to focus their practice time on.

Step 2 — Choice Practice Sheets
Based on their self-assessment, students selected from the following six practice sheets targeting their identified areas of difficulty.
Designing materials that allow students to self-direct their practice reflects the planning work that happens before instruction begins. By anticipating the range of student needs and preparing targeted practice options in advance, this activity demonstrates how thoughtful planning creates the conditions for process differentiation to happen naturally in the classroom.
Product
While the math department at my student teaching placement limited summative assessment formats to traditional tests, I varied the ways students demonstrated their formative understanding throughout each unit by intentionally selecting different assessment formats based on the nature of the lesson and learning objective. These included exit tickets, digital polls, and written responses. This variety ensured that no single format consistently advantaged or disadvantaged particular learners, and gave me multiple windows into student thinking across different types of tasks. Some of these formative assessments are discussed below in the Assessment Tools & Data Analysis section.
Assessment Tools & Data Analysis
Assessment Tools
Assessment tools I used range from quick formative checks like digital polls and exit tickets to more formal summative assessments. The summative assessments I used were uniform across the math department and were in traditional test formats, but I used a variety of formative assessment tools to gauge student understanding throughout each unit. These included digital polls, which allowed for anonymous participation and real-time feedback during lessons, and exit tickets, which provided a quick snapshot of student understanding at the end of class. By using multiple formats for formative assessment, I was able to capture a more complete picture of student learning and adjust my instruction accordingly.
These polls were incorporated into slides during a lesson on irrational numbers. This provided an anonymous way for students to participate in class and demonstrate their understanding.

Another way to assess student understanding was through exit tickets. I used a mix of digital and physical exit tickets as tools for students at the end of each lesson.

Data Analysis
I use both formative and summative assessment data to identify patterns in student understanding and inform my instructional decisions. Below is an example of how I analyzed data from a formative cool down assessment to identify common misconceptions and target areas for re-teaching in subsequent lessons, and a summative assessment data analysis that I used to evaluate overall student mastery of unit learning goals, identify trends across the class, and plan targeted review and extension opportunities.
The following cool down was administered at the end of a lesson on converting between standard and scientific notation. Cool downs were used regularly in my classes as a brief formative assessment tool to gauge student understanding before the next lesson. The scored results and analysis below reflect one administration of this assessment.
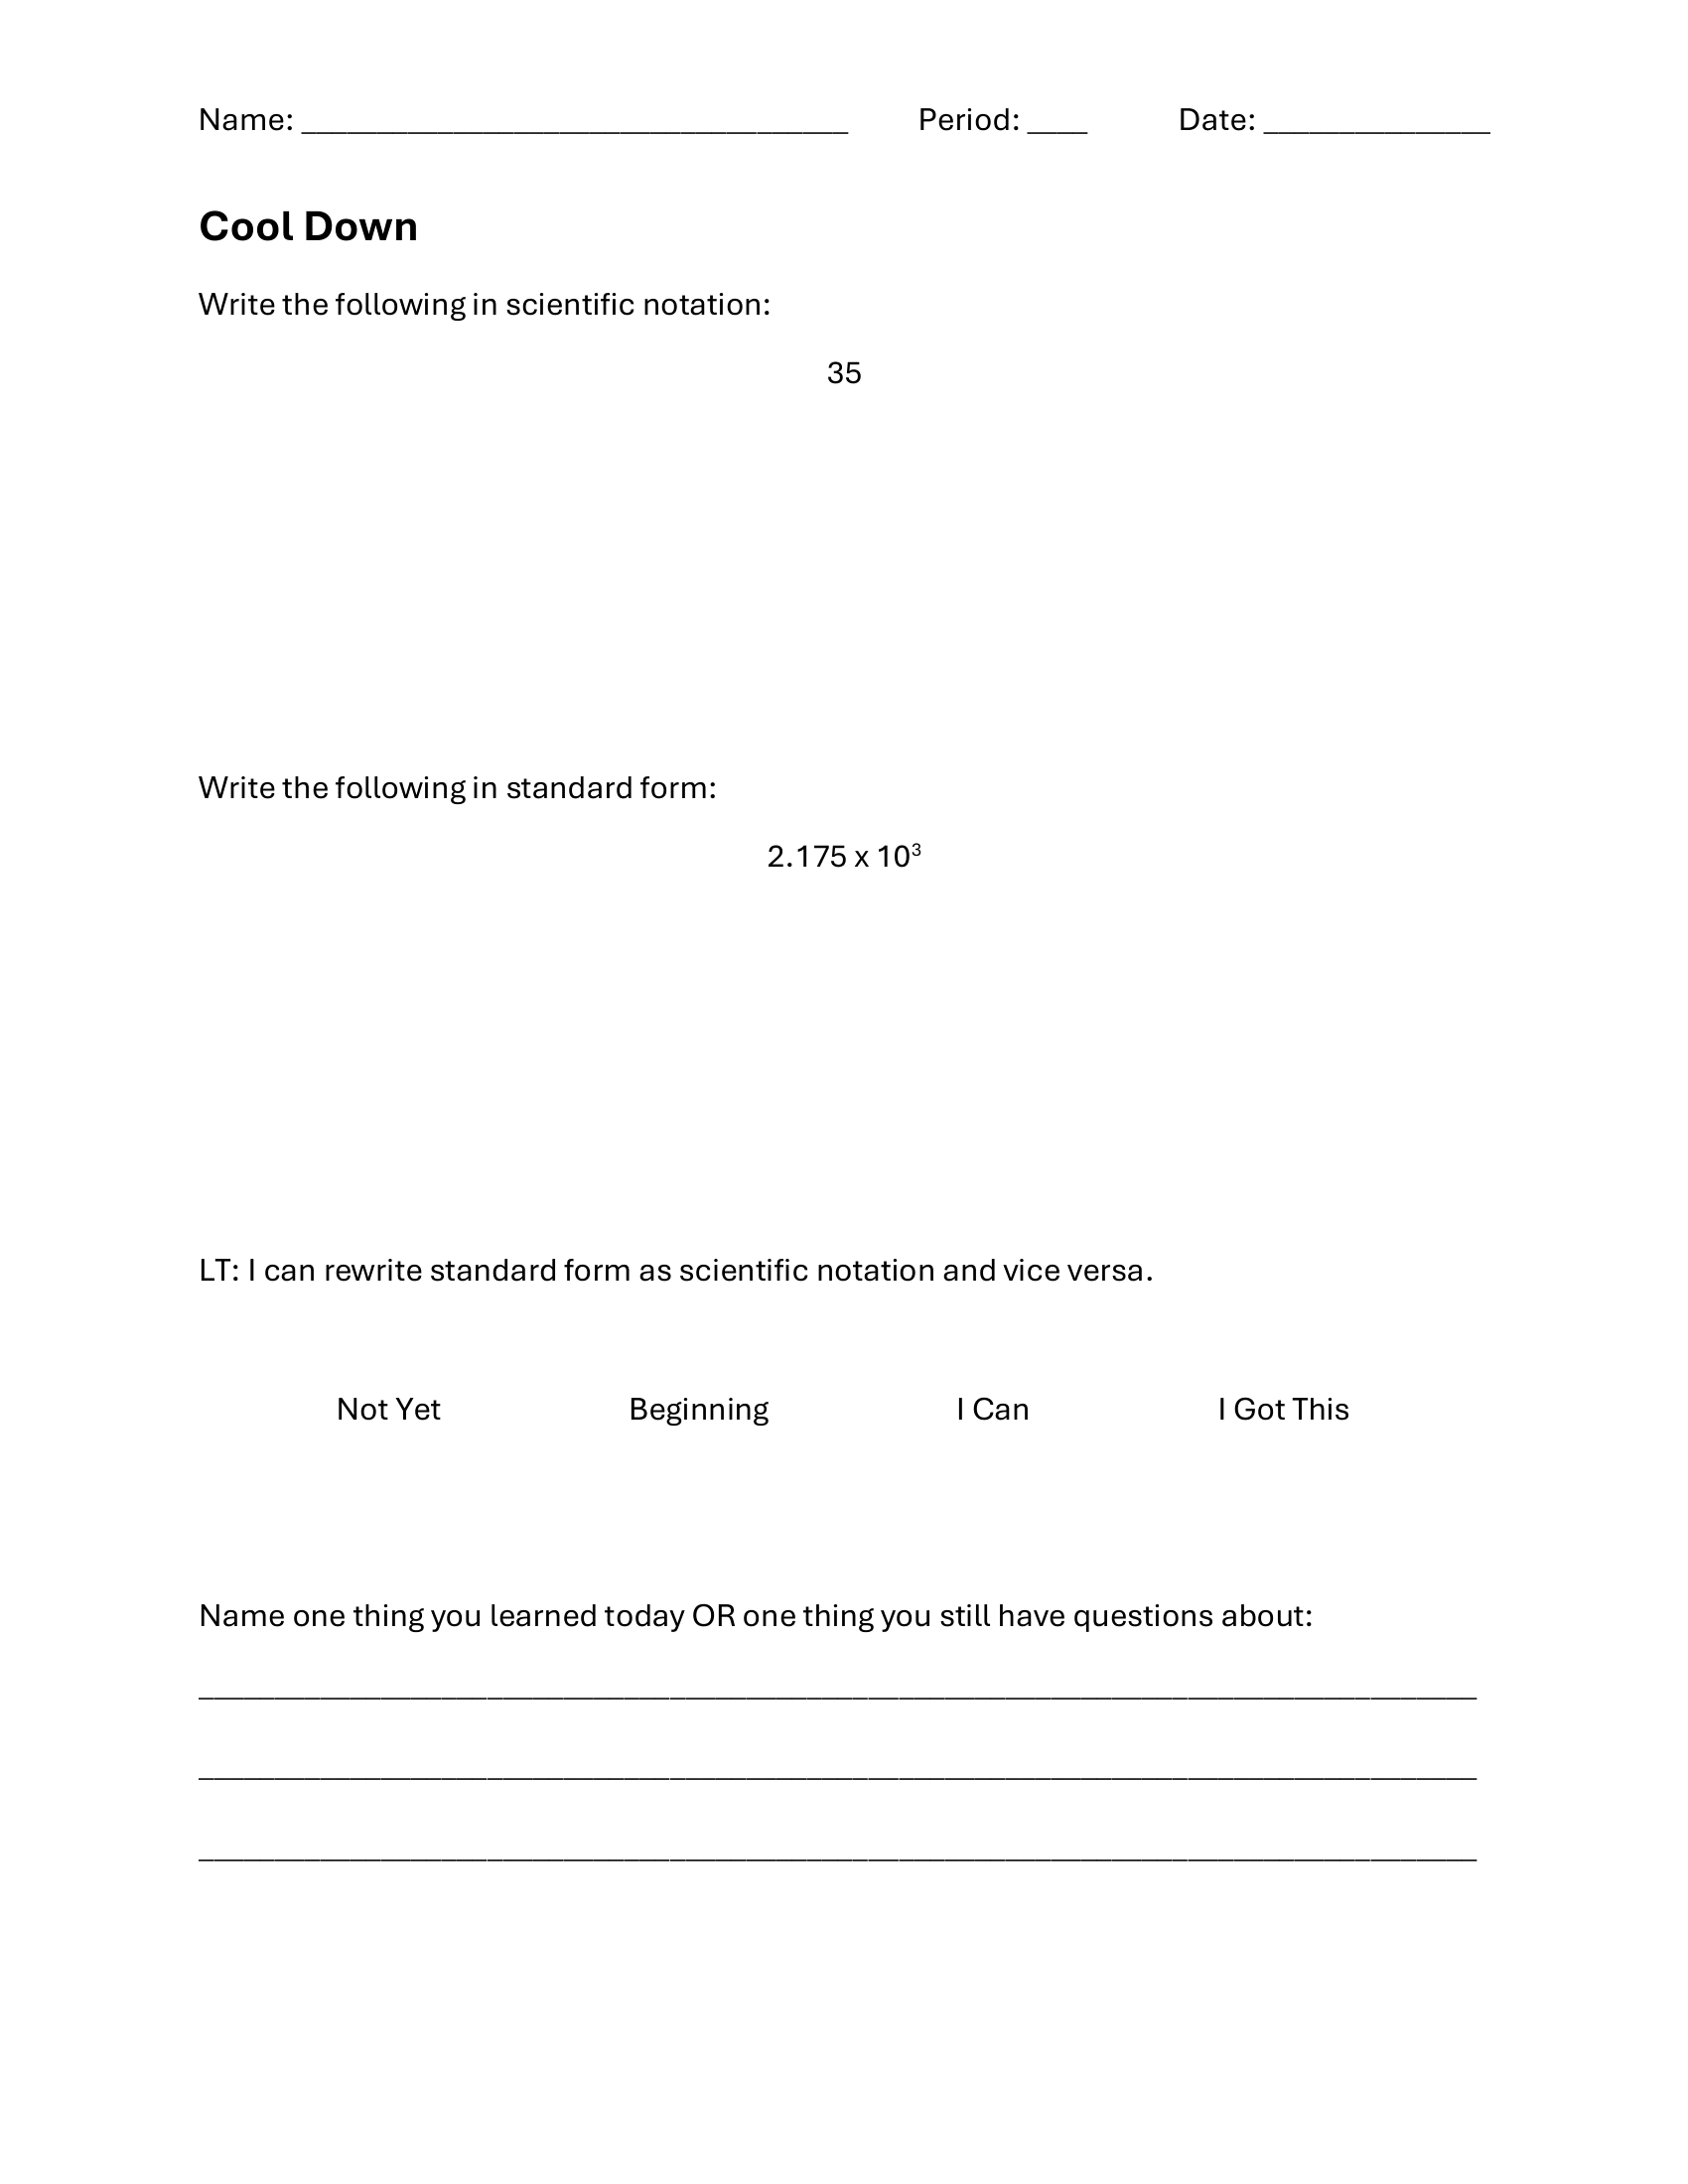
Question 1 — Converting from standard to scientific notation
| Score | Meaning |
|---|---|
| 0 | Did not attempt |
| 1 | No evidence of understanding |
| 2 | Not an equivalent expression but written in the form a × 10y |
| 3 | Equivalent expression written in the form a × 10y, but a is not between 1 and 10, or correct form and correct a with an incorrect exponent |
| 4 | Correct |
Question 2 — Converting from scientific to standard notation
| Score | Meaning |
|---|---|
| 0 | Did not attempt |
| 1 | No evidence of understanding |
| 2 | A number in standard form |
| 3 | Correct digits in the correct order — trailing zeros are acceptable (e.g. 21750 or 21.75) |
| 4 | Correct |
Raw data
| Student | Q1: Standard → Scientific | Q2: Scientific → Standard | Self-rating |
|---|---|---|---|
| Student 1 | 4 | 3 | 1 |
| Student 2 | 4 | 3 | 4 |
| Student 3 | 4 | 4 | 2 |
| Student 4 | 1 | 4 | 1 |
| Student 5 | 1 | 3 | 3 |
| Student 6 | 4 | 4 | 4 |
| Student 7 | 4 | 4 | 4 |
| Student 8 | 4 | 4 | 1 |
| Student 9 | 4 | 4 | 2 |
| Student 10 | 4 | 4 | 3 |
| Student 11 | 1 | 3 | 4 |
| Student 12 | 0 | 0 | 2 |
| Student 13 | 4 | 3 | 4 |
| Student 14 | 1 | 4 | 3 |
| Student 15 | 1 | 3 | 4 |
| Student 16 | 4 | 4 | 3 |
| Student 17 | 4 | 4 | 4 |
| Student 18 | 2 | 4 | 3 |
| Student 19 | 4 | 2 | 4 |
| Student 20 | 4 | 4 | 4 |
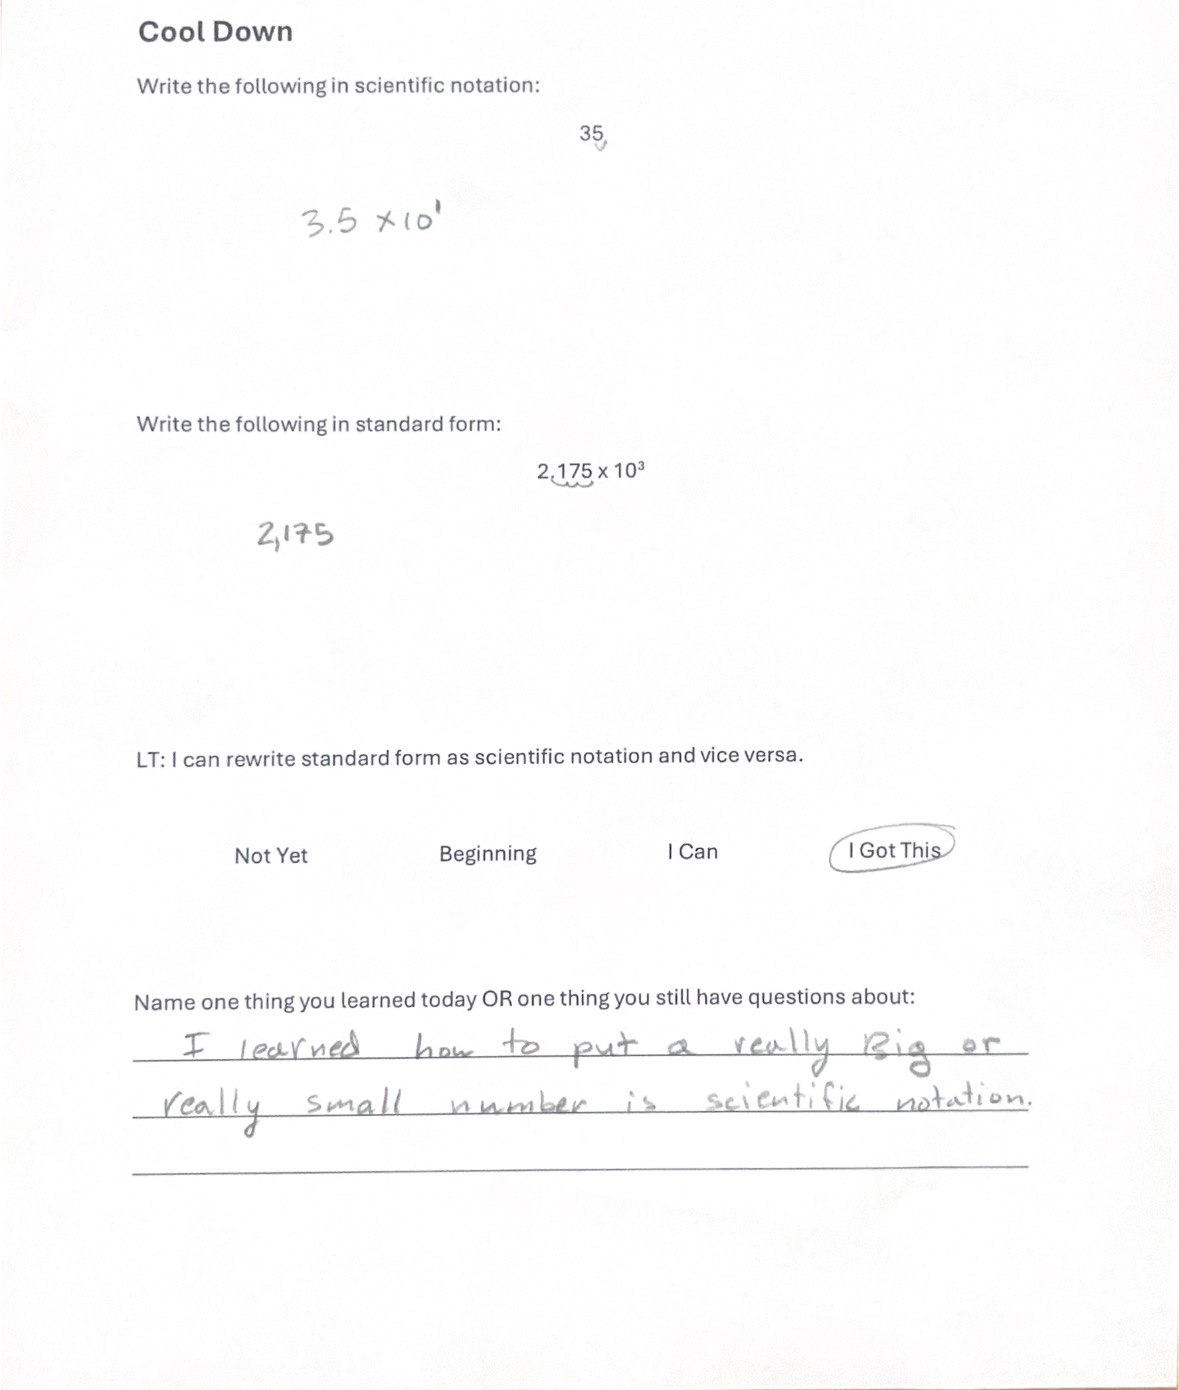
Analysis of the cool down data revealed a clear difference in student performance across the two conversion directions. Students demonstrated strong proficiency in converting from standard form to scientific notation, with the majority scoring at or near full marks on Question 1. However, approximately one third of students struggled with the reverse process, converting from scientific notation to standard form, suggesting that while students could produce scientific notation, interpreting and reversing the process was less secure.
Examining student work revealed two common error patterns on Question 2. The most frequent mistake was adding zeros rather than moving the decimal point. For example, interpreting 4.5 × 10³ as 4500 by appending three zeros rather than understanding it as a shift in place value. The second common error was moving the decimal in the wrong direction, indicating confusion about the relationship between the sign of the exponent and whether the resulting number should be larger or smaller. Both errors point to a gap in conceptual understanding of what the exponent represents in terms of the size and structure of the number.
While I did not design a formal re-teaching lesson in response to this data, I addressed these misconceptions directly in subsequent lessons by revisiting the conceptual reasoning behind decimal movement when they naturally arose. This experience reinforced for me the importance of building dedicated time for data review into my planning process so that patterns like these can be responded to more systematically in future practice.
The following student work samples illustrate the range of responses on the cool down, including examples of the two most common misconceptions identified in the data analysis above. All identifying information has been removed.
The following end-of-unit assessment was administered to my 8th grade students at the conclusion of the exponents unit. This assessment was designed collaboratively by the math department team, and I contributed to the process by providing input on problem selection and alignment to the learning objectives covered during my instruction. The scored results and analysis below reflect the performance of the classes I taught during this unit.
Question 1 — Equivalent Expressions (8.EE.A.1)
| Score | Meaning |
|---|---|
| 0 | Did not attempt |
| 1 | Any other option |
| 2 | 1 correct with no incorrect, or 2–3 correct with one incorrect |
| 3 | 2 correct with no incorrect |
| 4 | All 3 correct |
Question 2 — Fill in the Exponent (8.EE.A.1)
| Score | Meaning |
|---|---|
| 0 | Did not attempt |
| 1 | No correct expressions |
| 2 | One correct expression |
| 3 | 2 correct expressions |
| 4 | All 3 correct |
Question 3 — True or False (8.EE.A.1)
| Score | Meaning |
|---|---|
| 0 | Did not attempt |
| 1 | No correct |
| 2 | One correct |
| 3 | 2 correct |
| 4 | All 3 correct — note: scores reduced one level for missing explanations |
Question 4 — Simplify Expressions (8.EE.A.1)
| Score | Meaning |
|---|---|
| 0 | Did not attempt |
| 1 | 0–1 correct |
| 2 | 2–3 correct |
| 3 | 4 correct |
| 4 | All 5 correct |
Raw data
| Student | Q1: Equiv. Expressions | Q2: Fill in Exponent | Q3: True or False | Q4: Simplify |
|---|---|---|---|---|
| Student 1 | 2 | 3 | 3 | 2 |
| Student 2 | 2 | 0 | 0 | 0 |
| Student 3 | 3 | 3 | 2 | 3 |
| Student 4 | 3 | 4 | 4 | 4 |
| Student 5 | 2 | 4 | 4 | 4 |
| Student 6 | 4 | 4 | 4 | 4 |
| Student 7 | 4 | 4 | 4 | 4 |
| Student 8 | 1 | 4 | 2 | 1 |
| Student 9 | 2 | 4 | 3 | 1 |
| Student 10 | 4 | 4 | 3 | 4 |
| Student 11 | 1 | 2 | 0 | 0 |
| Student 12 | 2 | 2 | 1 | 3 |
| Student 13 | 2 | 4 | 4 | 4 |
| Student 14 | 1 | 3 | 3 | 2 |
| Student 15 | 1 | 2 | 3 | 4 |
| Student 16 | 4 | 4 | 4 | 4 |
| Student 17 | 4 | 4 | 4 | 4 |
| Student 18 | 1 | 2 | 3 | 2 |
| Student 19 | 1 | 3 | 3 | 2 |
| Student 20 | 4 | 3 | 2 | 2 |
| Student 21 | 1 | 2 | 3 | 3 |
| Student 22 | 2 | 3 | 4 | 4 |
| Student 23 | 3 | 4 | 4 | 4 |
| Student 24 | 4 | 4 | 4 | 4 |
| Student 25 | 4 | 4 | 4 | 2 |
| Student 26 | 2 | 4 | 4 | 2 |
| Student 27 | 3 | 3 | 3 | 1 |
| Student 28 | 4 | 4 | 4 | 2 |
Analysis of the 8.7 Exponents end-of-unit assessment revealed an interesting and somewhat unexpected pattern. Students performed strongest on Questions 2 and 3, filling in missing exponents and determining whether equations were true or false, with 79% of students scoring proficient or above on both. These questions required students to apply exponent rules in a structured way, and the results suggest that most students developed a solid procedural understanding of the rules covered in the unit.
However, performance was notably weaker on Questions 1 and 4. Question 1, which asked students to identify all equivalent expressions, had the lowest proficiency rate at 46%, with 7 students scoring a 1 and 8 scoring a 2. This is striking because selecting equivalent expressions requires the same underlying knowledge as the other questions, suggesting that the multiple-select format itself may have contributed to the lower scores. Students may have been uncertain about whether to select an answer when they were not fully confident, leading to omissions that dropped their score even when their partial understanding was sound. Question 4, which asked students to simplify five expressions using a single exponent, had a 54% proficiency rate, better than Question 1 but still below the class performance on Questions 2 and 3. The distribution here was more spread, with 8 students scoring a 2, suggesting partial mastery where students could simplify some but not all expressions correctly.
One factor worth noting is that Question 3 included a rubric penalty for missing explanations. Scores were reduced one level if students did not justify their true/false answers. Despite this added requirement, students still performed well on this question, which suggests they were generally able to articulate their reasoning when prompted to do so.
In hindsight, I would have used this data to design a targeted re-teaching session focused on recognizing equivalent expressions, particularly helping students develop confidence in the multiple-select format by practicing the strategy of testing each option independently rather than trying to evaluate all options at once. I would also have reviewed Question 4 errors to identify which specific exponent rules were causing the most difficulty, and addressed those specifically.